
I use EF Core almost exclusively for database access in my .NET projects. For the write side of almost any app, I want an aggregate that protects its own invariants, a repository that hides the database, and a unit of work that commits a transaction. EF Core gives me all of that without much ceremony. So when I say “here’s when I reached for Dapper,” I want to be clear up front: this isn’t a recommendation to replace EF Core, or even to use Dapper regularly. It’s a description of one place where EF Core’s own tools stopped being enough, and the rules I set for myself before I let a second data access library into the codebase.
The trigger is almost always a read endpoint. A list screen with filters and paging, a report that aggregates across a hundred thousand rows, a customer history export, something domain-driven design never really promised to be fast at. The order aggregate that protects “a submitted order can’t be modified” has no opinion about “show me the last 90 days of orders, by customer name, with a running total.” Those are different problems, and forcing one tool to solve both is where the trouble can start.
Our example is an order-management system with an Order aggregate on the write side, a Dapper-backed query layer on the read side, and five ways of fetching the same data (EF tracked, EF AsNoTracking, EF AsNoTracking with a projection, an EF compiled query, and Dapper) benchmarked against each other on 120,000 seeded orders in a containerized Postgres instance. The benchmark result I want to tease now: Dapper won three of the four scenarios, and EF Core won the fourth, cleanly, once I used EF’s own tools properly. Both of those facts matter more than “Dapper is faster,” which is the headline I was tempted to write before I ran the numbers.
The full companion solution runs entirely in Docker, including the tests and benchmarks, and every code snippet and SQL statement below is pulled directly from it.
The architecture: light CQRS
“CQRS” tends to conjure event sourcing, a separate read database, and a message bus, and that’s not what’s here. There’s no library involved either, no MediatR, no mediator pattern of any kind: this is the smallest version of command/query separation that’s still worth naming, built entirely out of plain classes and interfaces I own.
- Write side: a command handler calls a repository, which loads an
Orderaggregate, which enforces its own invariants, saved through EF Core and a unit of work. - Read side: a query service runs hand-written SQL through Dapper and returns a DTO. No repository, no aggregate, no domain type anywhere in the call stack.
- Same database. Same Postgres instance, same tables, same migrations (owned by EF Core). No separate read store, no projections to keep in sync, no eventual consistency to reason about.
- No mediator. Handlers are plain classes behind plain interfaces, resolved through constructor injection like anything else:
IOrderQueries,ICreateOrderHandler,ISubmitOrderHandler.
The one rule that makes this specific split work, and the one an architecture test enforces: repositories never serve reads, and query services never touch aggregates. That’s a rule for this architecture, not a universal law of repositories; an onion or vertical-slice architecture that isn’t drawing a write/read line in the first place might reasonably use the same repository for both, and that’s a legitimate choice there, not a violation of some broader principle. Here, where the whole point is keeping reads and writes on separate paths, a repository method whose return type ends in Dto is a bug, and so is anything in the read namespace referencing the Domain assembly. Two automated tests in the companion code check exactly this, and I’ll show them later.
What it isn’t: there’s no event store, no separate read database, no projection-rebuild job, and no mediator pattern. If you’re picturing a message bus and a read model that’s eventually consistent with the write model, that’s a different, heavier thing than what’s described here. This stays boring on purpose.
When to choose it, and when to skip it
Choose it when:
- Your read shapes genuinely diverge from your aggregates: list screens, dashboards, reports that join and aggregate across tables the aggregate doesn’t know about.
- There are real invariants on the write side worth protecting in code, not just in a check constraint. “An order can’t be modified after submission” is the kind of rule I want a unit test on, not a trigger.
- Reads dominate your traffic, and the heavy ones are genuinely heavy. Projections save real response time on a hot path, not a cron job nobody’s waiting on.
Skip it when:
- The app is mostly CRUD. If every query maps cleanly back to an aggregate or a thin projection of one, you don’t need a second data access tool.
- EF Core’s own projections already meet your performance target. “Meet the target” is doing the work here; benchmark first, see the next section.
- The team is small, and the cognitive cost of a second query language, a second set of conventions, and a second place SQL injection can sneak in isn’t worth whatever microseconds you’d save.
Alternatives I didn’t pick
Repositories only, no Dapper. The default, and right more often than this post might suggest. If AsNoTracking().Select(...) gets you where you need to go, stop there.
EF-only CQRS. Split the read and write models conceptually (IOrderQueries, DTOs, projections) but implement reads in EF Core too, without ever touching an aggregate. Most of the architectural benefit, no second library. The benchmarks below show it’s often fast enough that you should seriously consider stopping there.
Full CQRS with separate read and write stores. A materialized read database, projections kept current by an event stream or change-data-capture, independent scaling for reads and writes. Solves a different problem (traffic that can’t share infrastructure, or read models that reshape data far more than a SQL view can) at a real cost: eventual consistency, a projection pipeline to operate, a second database to back up. Nothing in this post’s traffic profile justified that.
Start with EF Core’s own fixes
Before any of this, there are four things worth trying first, roughly in order of effort:
AsNoTracking(): skip change tracking on read-only queries. Free, and it’s the first lever in the benchmarks below.Select()projections: project to a DTO shape in the query itself instead of materializing full entities and mapping afterward. This is where most of the gain actually comes from.- Compiled queries (
EF.CompileAsyncQuery): skip LINQ-to-SQL translation on repeat executions of the same query shape. Useful on a hot path, with a real caveat I’ll show in the benchmarks: some query shapes simply won’t compile. - Split queries (
AsSplitQuery()): avoid a cartesian explosion when a single query includes multiple collection navigations. Not exercised directly in this post’s scenarios, but worth knowing before reaching for Dapper on a query that’s slow because of a join explosion rather than genuine overhead.
Dapper is the last resort on this list, not the first. If AsNoTracking plus a projection gets you to your target, you’re done, and that was true for one of the four scenarios benchmarked below.
Where Dapper lives
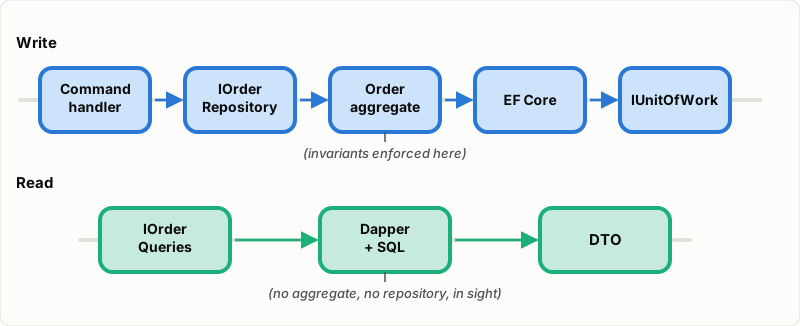
Dapper’s entire footprint is one namespace: Infrastructure.Reads. IOrderQueries is the only interface the Api project calls for reads, OrderQueries is its only implementation, and nothing in that class imports anything from Domain. Two deliberately contained, documented exceptions let Dapper touch the write side too (covered later), but the default rule holds: Dapper reads, EF Core writes.
Sharing a connection and transaction
The one place Dapper and EF Core’s write side meet is a transaction that must commit or roll back as a unit: submitting an order and writing an audit row. EfUnitOfWork wraps the whole thing in an EF Core transaction:
public async Task ExecuteInTransactionAsync(Func<CancellationToken, Task> action, CancellationToken cancellationToken = default)
{
    await using var transaction = await _context.Database.BeginTransactionAsync(cancellationToken);

    await action(cancellationToken);

    await transaction.CommitAsync(cancellationToken);
}
Inside that transaction, OrderAuditWriter borrows EF’s own connection and transaction instead of opening its own:
public async Task WriteAsync(Guid orderId, string eventName, CancellationToken cancellationToken = default)
{
    var connection = _context.Database.GetDbConnection();
    var transaction = _context.Database.CurrentTransaction?.GetDbTransaction();

    const string sql = """
        insert into order_audit_log (order_id, event_name, occurred_at_utc)
        values (@OrderId, @EventName, @OccurredAtUtc)
        """;

    var command = new CommandDefinition(
        sql,
        new { OrderId = orderId, EventName = eventName, OccurredAtUtc = DateTimeOffset.UtcNow },
        transaction,
        cancellationToken: cancellationToken);

    await connection.ExecuteAsync(command);
}
The important detail is what this code doesn’t do: it never calls Open(), Close(), or Dispose() on that connection, and it never commits or rolls back that transaction itself. EF owns both for their entire lifetime; Dapper is a guest. An integration test forces the audit insert to fail and asserts the order’s status change rolls back with it, which is the whole point of sharing the transaction in the first place.
Code walkthrough: a command handler and a query handler
Command handler. SubmitOrderHandler loads the aggregate through the repository, calls its one public method that enforces the invariant, and saves inside the shared transaction described above:
public async Task HandleAsync(SubmitOrderCommand command, CancellationToken cancellationToken = default)
{
    Domain.Order order = await _repository.GetByIdAsync(command.OrderId, cancellationToken)
        ?? throw new Domain.DomainException($"Order {command.OrderId} was not found.");

    order.Submit();

    await _unitOfWork.ExecuteInTransactionAsync(async ct =>
    {
        await _unitOfWork.SaveChangesAsync(ct);
        await _auditWriter.WriteAsync(order.Id, "OrderSubmitted", ct);
    }, cancellationToken);
}
Order.Submit() is where the actual invariant lives, not in the handler:
public void Submit()
{
    if (Status != OrderStatus.Draft)
    {
        throw new DomainException($"Only draft orders can be submitted. Order {Id} is {Status}.");
    }

    if (_lines.Count == 0)
    {
        throw new DomainException("An order must have at least one line before it can be submitted.");
    }

    Status = OrderStatus.Submitted;
    SubmittedAtUtc = DateTimeOffset.UtcNow;
}
The repository behind _repository.GetByIdAsync is nothing more than an Include:
public Task<Order?> GetByIdAsync(Guid orderId, CancellationToken cancellationToken = default)
{
    return _context.Orders
        .Include(o => o.Lines)
        .FirstOrDefaultAsync(o => o.Id == orderId, cancellationToken);
}
Query handler. The order-detail query is the read-side equivalent, and it never touches Order or OrderLine:
public async Task<OrderDetailDto?> GetOrderDetailAsync(Guid orderId, CancellationToken cancellationToken = default)
{
    const string headerSql = """
        select o.id as OrderId, o.customer_id as CustomerId, c.name as CustomerName,
               o.status as Status, o.created_at_utc as CreatedAtUtc, o.submitted_at_utc as SubmittedAtUtc
        from orders o
        join customers c on c.id = o.customer_id
        where o.id = @OrderId
        """;

    const string linesSql = """
        select ol.product_id as ProductId, p.name as ProductName, ol.quantity as Quantity,
               ol.unit_price as UnitPrice, (ol.quantity * ol.unit_price) as LineTotal
        from order_lines ol
        join products p on p.id = ol.product_id
        where ol.order_id = @OrderId
        """;

    using var connection = _connectionFactory.CreateConnection();
    await connection.OpenAsync(cancellationToken);

    using var multi = await connection.QueryMultipleAsync(new CommandDefinition(
        $"{headerSql};{linesSql}", new { OrderId = orderId }, cancellationToken: cancellationToken));

    var header = await multi.ReadSingleOrDefaultAsync<OrderHeaderRow>();
    if (header is null)
    {
        return null;
    }

    var lines = (await multi.ReadAsync<OrderDetailLineDto>()).ToList();

    return new OrderDetailDto(
        header.OrderId, header.CustomerId, header.CustomerName, header.Status,
        header.CreatedAtUtc, header.SubmittedAtUtc, lines.Sum(l => l.LineTotal), lines);
}
Two round trips, two plain SQL statements, one DTO out. Nothing here could accidentally leak into the write path; the architecture test described below makes sure of it.
The gray area: set-based writes that bypass the aggregate
Not every write needs an aggregate. A nightly batch job that marks thousands of submitted orders as shipped once they’ve aged past a cutoff doesn’t protect any invariant that a WHERE clause can’t express, and loading each Order into memory just to flip one status column is pure overhead. BulkMarkOrdersShippedHandler does this as a plain UPDATE:
const string sql = """
    update orders
    set status = 'Shipped'
    where status = 'Submitted'
      and submitted_at_utc < @CutoffUtc
    """;
This is a real exception to “writes go through the aggregate,” and I don’t want to pretend otherwise. What keeps it from becoming a crack that widens over time:
- It lives in its own named class, in its own namespace (
Infrastructure.WriteExceptions), not folded intoOrderRepository. - The one invariant that matters here, that only a
Submittedorder can becomeShipped, is encoded directly in theWHEREclause, and mirrors a domain-level test (MarkShipped_FromDraft_Throws) that checks the same rule on the normal, per-aggregate path. - An architecture test pins the exact, short list of classes allowed to use Dapper for a write. Anything added outside that list fails the build.
If this handler ever needed to do something an aggregate would catch and a WHERE clause can’t (say, recording a domain event, or validating something more complex than a status comparison), that’s the signal to stop and go back through the aggregate, even at the cost of looping over orders one at a time.
Guardrails for a team
Three mechanisms keep this honest as a team grows, enforced by the build rather than by review memory:
Dapper is quarantined to two namespaces. This NetArchTest finds every type in Infrastructure that references Dapper and fails the build if it’s outside Reads or the two named exceptions in WriteExceptions:
[Fact]
public void DapperIsOnlyReferencedFromReadsOrDocumentedWriteExceptions()
{
    var typesUsingDapper = Types.InAssembly(InfrastructureAssembly)
        .That()
        .HaveDependencyOn("Dapper")
        .GetTypes()
        .ToList();

    var offenders = typesUsingDapper
        .Where(t => t.Namespace is not "OrderLightCqrs.Infrastructure.Reads"
                    and not "OrderLightCqrs.Infrastructure.WriteExceptions")
        .Select(t => t.FullName)
        .ToList();

    Assert.True(offenders.Count == 0, $"Types referencing Dapper outside Reads/WriteExceptions: {string.Join(", ", offenders)}");

    var writeExceptionTypes = typesUsingDapper
        .Where(t => t.Namespace == "OrderLightCqrs.Infrastructure.WriteExceptions")
        .Select(t => t.Name)
        .OrderBy(n => n)
        .ToList();

    Assert.Equal(new[] { "BulkMarkOrdersShippedHandler", "OrderAuditWriter" }, writeExceptionTypes);
}
Repositories can’t return DTOs, and query services can’t return domain types. Two more architecture tests check both directions: every method on a type implementing IOrderRepository is scanned for a return type ending in Dto, and the Infrastructure.Reads namespace is asserted to have no dependency on Domain at all.
Parameterized queries only. Every Dapper call passes parameters through CommandDefinition objects (new { OrderId = orderId }), never string interpolation into SQL. Not automated here, but a one-line PR checklist item: reject any Dapper query that builds its WHERE clause with $"..." instead of a parameter.
A short review checklist worth pinning to a PR template: does the query live in Reads (or one of the two named exceptions)? Are all parameters passed, not interpolated? Does it return a DTO, never a domain type? Has its output been diffed against the equivalent EF query on real data?
Benchmarks
Four scenarios, all run with BenchmarkDotNet, in Release configuration, inside Docker Compose against a warm, seeded PostgreSQL 17 container. Both the Postgres container and the benchmark runner were capped at cpus: "2", memory: 2G; the host was a 12th-generation Intel Core i5-12600K. These are relative comparisons between query strategies on one machine, not absolute numbers to expect on yours. The seed data was 3,000 customers, 400 products, 120,000 orders, and roughly 426,000 order lines, with customer order counts skewed (one customer pinned to a large, recurring history for scenario 4) rather than evenly distributed. All five implementations in every scenario were verified to return identical results before benchmarking.
Every row in these tables ran against the identical DTO shape, and every Dapper query here is SQL I’d actually write by hand for the job, not something contrived to win a benchmark.
Scenario 1: order list page
A paged, filtered, sorted list: status Submitted, a 90-day date window (matching roughly 60,000 of the 120,000 seeded orders), page 2 of 50, showing customer name, line count, and order total. This is the screen that loads on every visit to an orders list, a real business reason to care about its latency.
| Variant | Mean | Allocated |
|---|---|---|
| EF tracked entities | 6.91 ms | 516 KB |
EF AsNoTracking | 4.20 ms | 287 KB |
EF AsNoTracking + Select projection | 3.43 ms | 126 KB |
| EF compiled query + projection | N/A | - |
| Dapper | 2.39 ms | 27 KB |
The compiled-query row is N/A for a real reason: EF.CompileAsyncQuery throws InvalidOperationException: ... could not be translated for this shape, a correlated scalar subquery for the customer name combined with a correlated Count()/Sum() over the Lines navigation in the same projection. The identical LINQ, uncompiled, works fine one line above it in the same file; compilation is what breaks it.
There’s a second honest result in this scenario. My first Dapper attempt grouped and joined across all ~60,000 matching orders before applying OFFSET/LIMIT, and measured at 34 ms, slower than every EF variant above. The fix was to paginate first in a CTE, then join only the 50 rows on that page:
with paged_orders as (
    select o.id, o.customer_id, o.created_at_utc, o.status
    from orders o
    where (@Status is null or o.status = @Status)
      and (@FromUtc is null or o.created_at_utc >= @FromUtc)
      and (@ToUtc is null or o.created_at_utc < @ToUtc)
    order by o.created_at_utc desc
    offset @Offset limit @PageSize
)
select
    po.id as OrderId,
    c.name as CustomerName,
    po.created_at_utc as CreatedAtUtc,
    po.status as Status,
    count(ol.id)::int as LineCount,
    coalesce(sum(ol.quantity * ol.unit_price), 0) as Total
from paged_orders po
join customers c on c.id = po.customer_id
left join order_lines ol on ol.order_id = po.id
group by po.id, c.name, po.created_at_utc, po.status
order by po.created_at_utc desc
That’s exactly what EF does internally when it paginates a query with a collection Include: resolve the page first, then join the collection against just that page. The lesson wasn’t “Dapper is faster,” it was “EF’s query shaping is worth copying,” and the SQL above exists because I copied it.
Scenario 2: order detail view
A single order with its lines and product names: small result, high call volume, the scenario where per-call overhead should matter most and query complexity least.
| Variant | Mean | Allocated |
|---|---|---|
| EF tracked entities | 2,136 µs | 98.2 KB |
EF AsNoTracking | 2,000 µs | 98.5 KB |
EF AsNoTracking + Select projection | 1,653 µs | 102.5 KB |
| EF compiled query + projection | 1,206 µs | 65.2 KB |
| Dapper | 627 µs | 6.3 KB |
This is the one scenario where EF’s generated SQL and the hand-written Dapper SQL do nearly the same thing structurally. EF issues two round trips, matching Dapper’s QueryMultiple, one for the header and one for the lines:
-- header
SELECT o.id AS "Id", o.customer_id AS "CustomerId",
       (SELECT c.name FROM customers AS c WHERE c.id = o.customer_id LIMIT 1) AS "CustomerName",
       o.status::text AS "Status", o.created_at_utc AS "CreatedAtUtc", o.submitted_at_utc AS "SubmittedAtUtc"
FROM orders AS o
WHERE o.id = @orderId

-- lines
SELECT o.product_id AS "ProductId",
       (SELECT p.name FROM products AS p WHERE p.id = o.product_id LIMIT 1) AS "ProductName",
       o.quantity AS "Quantity", o.unit_price AS "UnitPrice", o.quantity::numeric(18,2) * o.unit_price AS "LineTotal"
FROM order_lines AS o
WHERE o.order_id = @orderId
The only structural difference is EF’s correlated scalar subquery for CustomerName/ProductName where Dapper uses a plain join. Both plans do the same real work; the gap here is pure materialization and mapping overhead on EF’s side, not a smarter query: the clearest, least confounded result in this post.
Scenario 3: sales report
Revenue by product category and month, aggregated across the last 12 months of orders: heavy aggregation across most of the seeded 120,000 orders, the scenario where I expected either the largest gap or none at all.
| Variant | Mean | Allocated |
|---|---|---|
| EF tracked, grouped in memory | 2,100 ms | 788 MB |
EF AsNoTracking, grouped in memory | 894 ms | 389 MB |
EF AsNoTracking + Select (GroupBy → SQL) | 759 ms | 128 KB |
EF compiled query + projection (GroupBy → SQL) | 756 ms | 92 KB |
| Dapper | 974 ms | 29 KB |
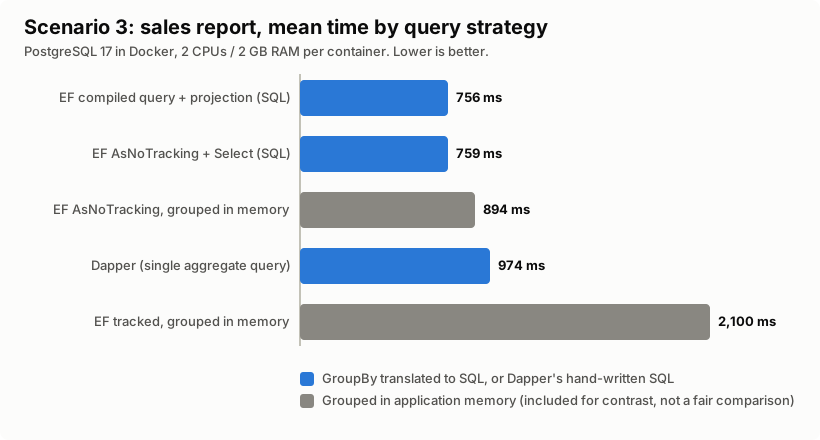
This is the scenario to feature, not bury: both SQL-translated EF variants beat Dapper here, and by a comfortable margin. The gap isn’t about the tool, it’s about the plan. EF’s generated SQL for the GroupBy wraps the joins in a subquery, then aggregates on the outside:
SELECT s.category AS "Category", s."Year", s."Month",
       COALESCE(sum(s.quantity::numeric(18,2) * s.unit_price), 0.0) AS "Revenue",
       count(DISTINCT s.id0)::int AS "OrderCount"
FROM (
    SELECT o.quantity, o.unit_price, o0.id AS id0, p.category,
           date_part('year', o0.created_at_utc AT TIME ZONE 'UTC')::int AS "Year",
           date_part('month', o0.created_at_utc AT TIME ZONE 'UTC')::int AS "Month"
    FROM order_lines AS o
    INNER JOIN orders AS o0 ON o.order_id = o0.id
    INNER JOIN products AS p ON o.product_id = p.id
    WHERE o0.created_at_utc >= @reportFromUtc AND o0.created_at_utc < @reportToUtc AND o0.status <> 'Cancelled'
) AS s
GROUP BY s.category, s."Year", s."Month"
The hand-written Dapper version groups directly over the joined rows in one flat statement, the more “natural” way to write this by hand. It isn’t the faster plan. I don’t have a confident explanation for why Postgres’s planner prefers EF’s subquery-then-aggregate shape over the flatter one, and I’d rather say that than invent one. What I can say with confidence: this is a real, reproducible case where AsNoTracking plus a Select projection beat hand-written Dapper SQL on a heavy aggregation. If I’d stopped at “Dapper is for reporting queries” as a rule of thumb, this benchmark proved that rule wrong.
The two in-memory-grouped rows at the top aren’t a fair fight; they show what forgetting to translate the GroupBy to SQL costs: 788 MB allocated for tracked entities pulled into memory and grouped by LINQ instead of letting Postgres do it.
Scenario 4: customer order history export
Every order and line for one customer with a large history (roughly 2,400 lines): a large result set where materialization cost, not query planning, should dominate.
| Variant | Mean | Allocated |
|---|---|---|
| EF tracked entities | 207 ms | 68.8 MB |
EF AsNoTracking | 194 ms | 34.3 MB |
EF AsNoTracking + Select projection | 113 ms | 19.5 MB |
| EF compiled query + projection | 118 ms | 19.2 MB |
| Dapper | 83 ms | 15.1 MB |
This is the cleanest apples-to-apples comparison in the whole set, because the generated SQL and the hand-written SQL are nearly identical:
SELECT o.id AS "Id", o.created_at_utc AS "CreatedAtUtc", o.status::text AS "Status",
       o0.product_id AS "ProductId", p.name AS "Name", o0.quantity AS "Quantity",
       o0.unit_price AS "UnitPrice", o0.quantity::numeric(18,2) * o0.unit_price AS "LineTotal"
FROM orders AS o
INNER JOIN order_lines AS o0 ON o.id = o0.order_id
INNER JOIN products AS p ON o0.product_id = p.id
WHERE o.customer_id = @customerId
ORDER BY o.created_at_utc DESC
No correlated subqueries, no nested aggregation, plain joins, same filter, same ordering as the Dapper query it’s competing against. The database does the same work either way. The remaining ~27% gap (113 ms EF versus 83 ms Dapper) is purely the cost of EF’s materialization machinery over roughly 2,400 rows, not a smarter or dumber query plan. If you want one number to justify “Dapper has lower per-row overhead on large result sets,” this is the scenario to point at, because the SQL on both sides is close enough to rule out plan differences.
What the benchmarks actually say
Three of four scenarios favor Dapper, by margins from about 1.4x (sales report, where it loses) to about 3.4x (order detail). One favors EF Core outright, once I used AsNoTracking and a projection instead of tracked entities grouped in memory. None of the four scenarios needed Dapper to hit an acceptable number if “acceptable” means “better than tracked entities”: AsNoTracking plus a projection alone closed most of the gap in every case. Dapper’s remaining advantage, where it has one, is consistently lower allocations and lower per-call overhead, not a fundamentally different query plan; in two of the four scenarios the generated SQL and the hand-written SQL are close enough that the comparison is really “ORM materialization cost versus none,” not “smart SQL versus dumb SQL.”
Counterarguments, and where this lands
“EF Core is fast enough.” For most of what most apps do, yes, and the scenario-3 result above is the proof I didn’t expect to find in my own benchmark: EF’s own tools, used correctly, beat hand-written SQL on a heavy aggregation. The way to check this for your own app isn’t to guess, it’s to do what this post did: write the EF query with AsNoTracking and a projection, write the Dapper equivalent, run both against production-shaped data, and look at the actual numbers before reaching for a second tool.
The cognitive cost of two tools is real. A team now needs to know two query languages, two sets of idioms for pagination and parameterization, and one more place a SQL injection vulnerability or an N+1 query can hide. There’s a type-safety cost too: an EF LINQ query is checked by the compiler against the model, so renaming a column or changing a property’s type breaks the build. A Dapper query is a string; the same rename breaks it silently, and the only thing that catches it is a test actually running that query against real data, or a user hitting it in production. The architecture tests in this post exist specifically to pay down part of that cost: they turn “Dapper stays in the read layer” from a convention someone has to remember into something the build enforces.
The rule I actually follow: EF Core first, always, for everything on the write side and for most reads. Dapper only after AsNoTracking and a projection have both been tried and measured, only in a query layer that never sees an aggregate, and only with an architecture test making sure it stays that way. That’s a narrower rule than “use the fastest tool,” and it’s the one I’d actually want a team to follow after I’ve moved on to the next project.
References
- Microsoft. Dapper: query data. EF Core efficient querying, Microsoft Learn.
- Microsoft. Compiled queries. EF Core advanced performance topics, Microsoft Learn.
- Microsoft. AsNoTracking. EF Core tracking vs. no-tracking queries, Microsoft Learn.